OUR PERSONNEL
OUR SUCCESSFUL BUSINESS DEVELOPMENT IS DRIVEN BY PEOPLE: IT IS OUR STAFF WHOSE DEDICATION AND EXPERTISE HELP TO BRING ABOUT CHANGE WORLDWIDE. IN AROUND 120 COUNTRIES, THEY ACTIVELY SUPPORT OUR COMMISSIONING PARTIES AND PARTNERS IN REALISING THEIR IDEAS AND CREATING PROSPECTS FOR LOCAL PEOPLE.
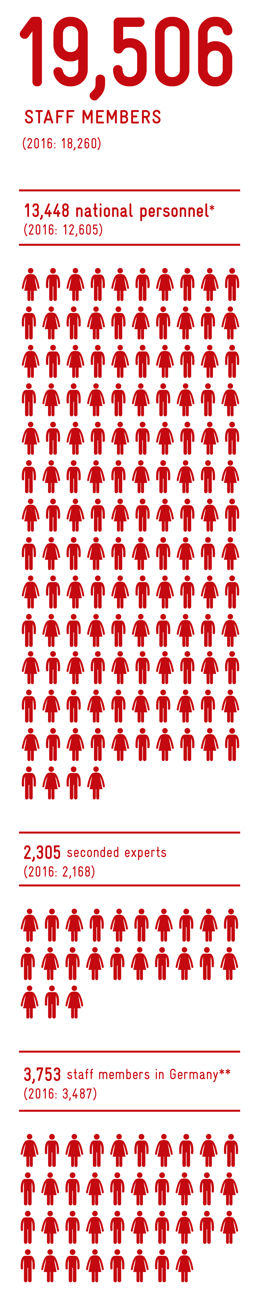
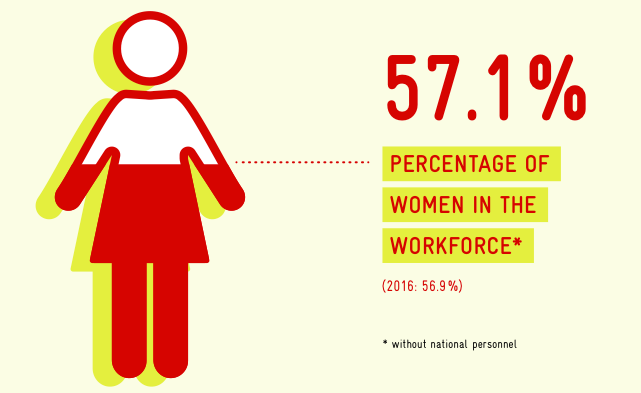
As at 31 December 2017, GIZ employed a total of 19,506 staff, an increase of almost seven per cent compared to the 18,260 in 2016. The expanding workforce shows that our services continue to be in demand and that we are seen as an attractive employer in the field of international cooperation for sustainable development.
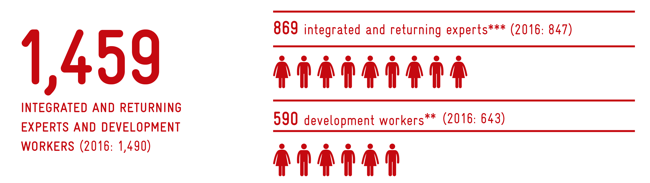
In addition to our long-term and short-term experts and our national personnel in partner countries, who account for the greatest share of our total workforce, another 1,459 people had positions through GIZ as development workers, integrated experts and returning experts. In total, more than 80 per cent of GIZ’s staff were based outside Germany. Find out more about working for GIZ: www.giz.de/en/jobs
Our Human Resources Strategy 2017 – 2019
Professional, international, mobile and cooperative – these are the ultimate goals of our new Human Resources (HR) Strategy, which was adopted in 2017. The strategy sets our course for HR work in the future. The first measures have already been implemented, with a view to making field assignments more attractive and thus improving the company’s ability to deliver. The HR Strategy is part of the company’s Corporate Strategy and works on three levels: the expectations of commissioning parties are weighed against the needs of GIZ as a company and the wishes of staff, and an equitable balance is found.